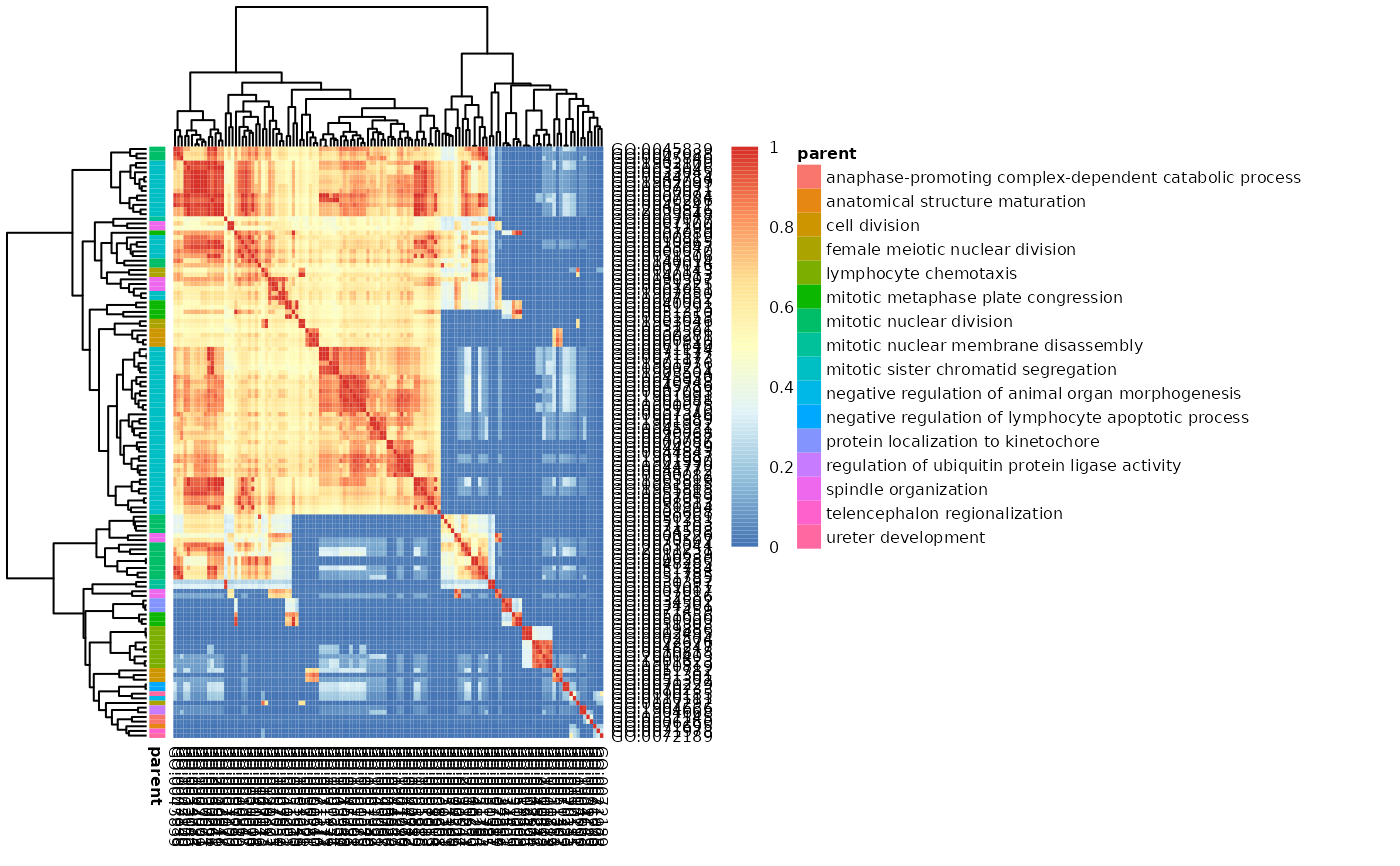
heatmapPlot Plot similarity matrix as a heatmap
heatmapPlot.RdheatmapPlot Plot similarity matrix as a heatmap
heatmapPlot(
  simMatrix,
  reducedTerms = NULL,
  annotateParent = TRUE,
  annotationLabel = "parentTerm",
  ...
)
Arguments
Value
Invisibly a pheatmap object that is a list with components
Details
Matrix with similarity scores between terms is represented as a heatmap.
Examples
go_analysis <- read.delim(system.file("extdata/example.txt", package="rrvgo"))
simMatrix <- calculateSimMatrix(go_analysis$ID, orgdb="org.Hs.eg.db", ont="BP", method="Rel")
#> preparing gene to GO mapping data...
#> preparing IC data...
scores <- setNames(-log10(go_analysis$qvalue), go_analysis$ID)
reducedTerms <- reduceSimMatrix(simMatrix, scores, threshold=0.7, orgdb="org.Hs.eg.db")
#> 'select()' returned 1:many mapping between keys and columns
heatmapPlot(simMatrix, reducedTerms, annotateParent=TRUE, annotationLabel="parentTerm", fontsize=6)