Identify genes plotted by duprateExpPlot
duprateExpIdentify.RdduprateExpIdentify Identify genes plotted by duprateExpPlot
duprateExpIdentify(DupMat, idCol = "ID")Arguments
Value
The identified points. x and y values match the ones
from duprateExpPlot
Details
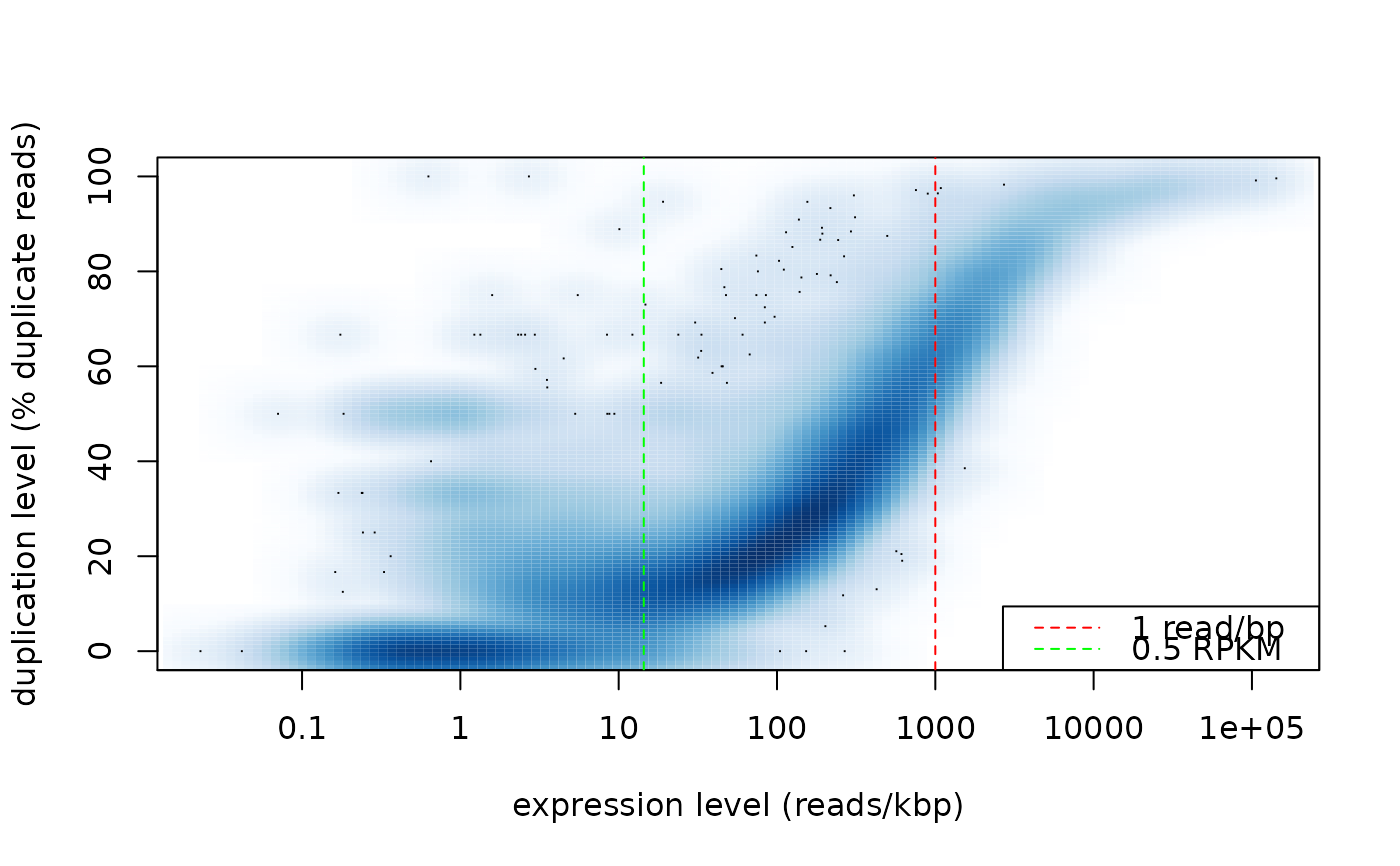
This function makes a barplot showing the cumulative read counts fraction
from the duplication matrix calculated by analyzeDuprates.
Examples
# dm is a duplication matrix calculated by analyzeDuprates:
# R> dm <- analyzeDuprates(bamDuprm,gtf,stranded,paired,threads)
attach(dupRadar_examples)
#> The following objects are masked from dupRadar_examples (pos = 3):
#>
#>     dm, dm.bad
#> The following objects are masked from dupRadar_examples (pos = 4):
#>
#>     dm, dm.bad
#> The following objects are masked from dupRadar_examples (pos = 5):
#>
#>     dm, dm.bad
#> The following objects are masked from dupRadar_examples (pos = 6):
#>
#>     dm, dm.bad

# call the plot and identify genes
duprateExpPlot(DupMat=dm)
duprateExpIdentify(DupMat=dm)

#> integer(0)