Duplication rate ~ total read count plot
duprateExpPlot.RdduprateExpPlot Duplication rate ~ total read count plot
duprateExpPlot(
  DupMat,
  tNoAlternative = TRUE,
  tRPKM = TRUE,
  tRPKMval = 0.5,
  addLegend = TRUE,
  ...
)
Arguments
Value
nothing
Details
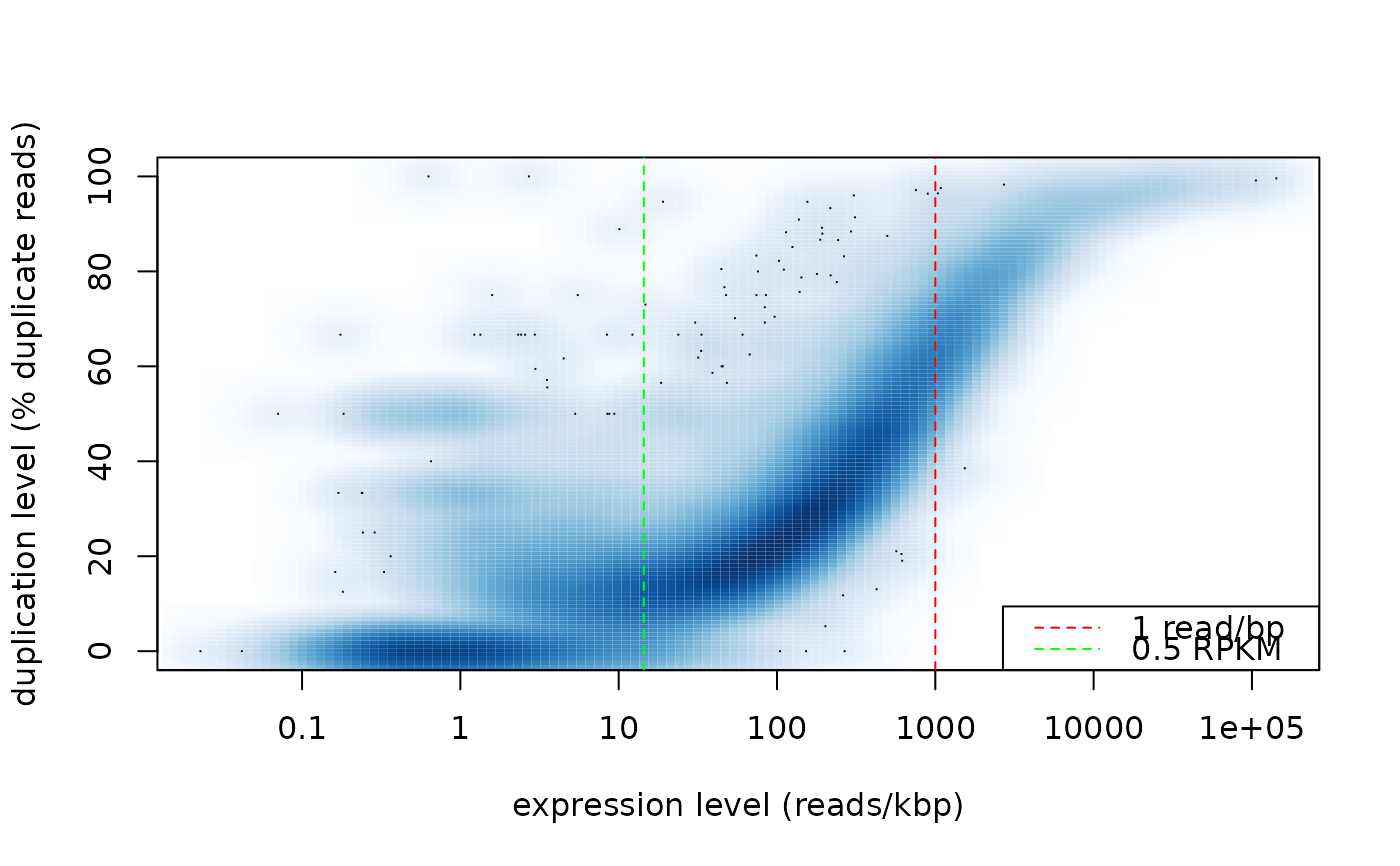
This function makes a smooth scatter plot showing the per gene duplication rate versus the total read count.
Examples
# dm is a duplication matrix calculated by analyzeDuprates:
# R> dm <- analyzeDuprates(bamDuprm,gtf,stranded,paired,threads)
attach(dupRadar_examples)
#> The following objects are masked from dupRadar_examples (pos = 3):
#>
#>     dm, dm.bad
#> The following objects are masked from dupRadar_examples (pos = 4):
#>
#>     dm, dm.bad
#> The following objects are masked from dupRadar_examples (pos = 5):
#>
#>     dm, dm.bad
#> The following objects are masked from dupRadar_examples (pos = 6):
#>
#>     dm, dm.bad
#> The following objects are masked from dupRadar_examples (pos = 7):
#>
#>     dm, dm.bad

# duprate plot
duprateExpPlot(DupMat=dm)