Duplication rate ~ total read count plot
duprateExpDensPlot.RdduprateExpDensPlot Duplication rate ~ total read count plot
duprateExpDensPlot(
  DupMat,
  pal = c("cyan", "blue", "green", "yellow", "red"),
  tNoAlternative = TRUE,
  tRPKM = TRUE,
  tRPKMval = 0.5,
  tFit = TRUE,
  addLegend = TRUE,
  ...
)
Arguments
- DupMat
The duplication matrix calculated by
analyzeDuprates- pal
The color palette to use to display the density
- tNoAlternative
Display threshold of 1000 reads per kilobase
- tRPKM
Display threshold at a given RPKM level
- tRPKMval
The given RPKM level
- tFit
Whether to fit the model
- addLegend
Whether to add a legend to the plot
- ...
Other parameters sent to plot()
Value
nothing
Details
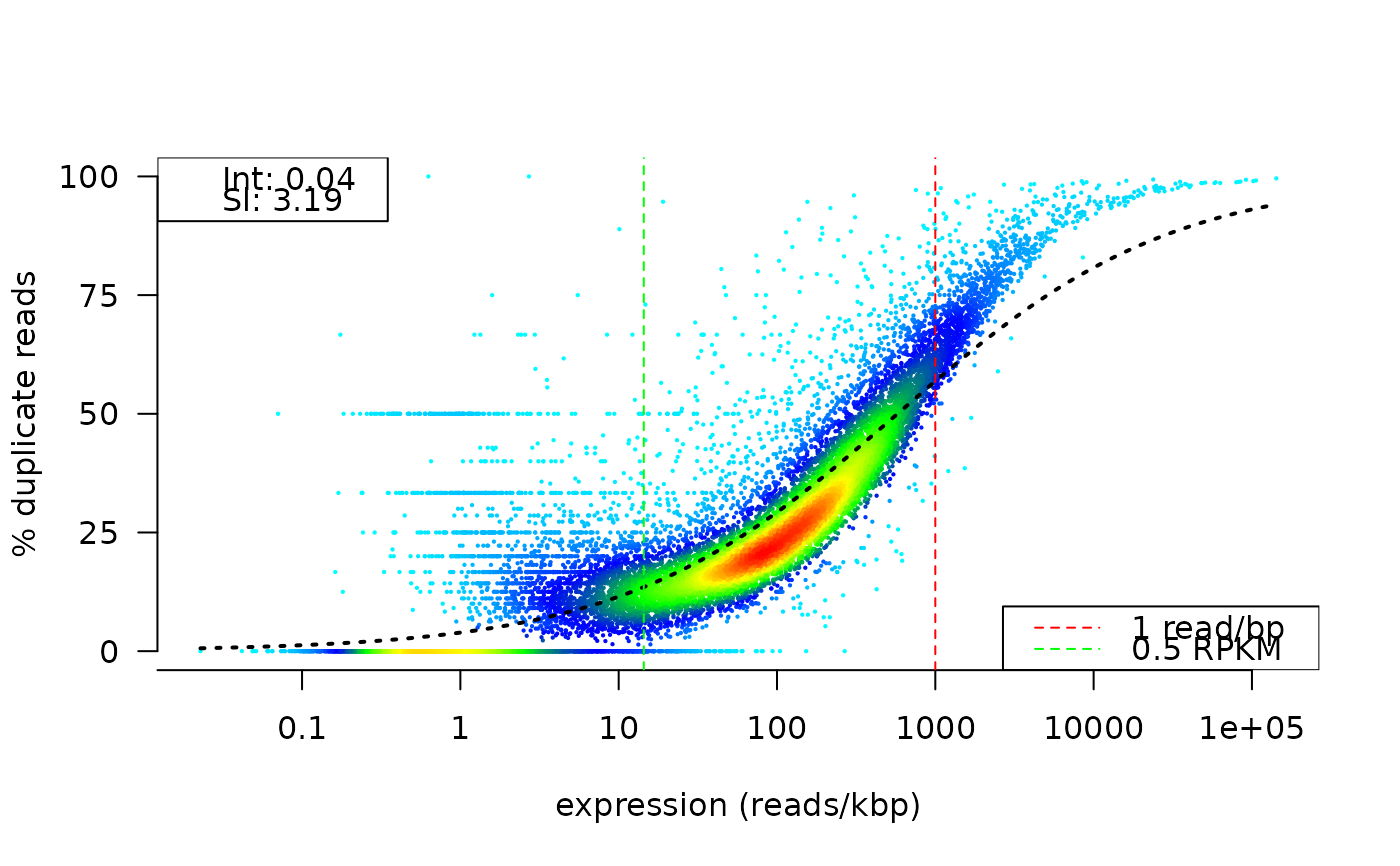
This function makes a scatter plot showing the per gene duplication rate versus the total read count.
Examples
# dm is a duplication matrix calculated by analyzeDuprates:
# R> dm <- analyzeDuprates(bamDuprm,gtf,stranded,paired,threads)
attach(dupRadar_examples)
#> The following objects are masked from dupRadar_examples (pos = 3):
#>
#>     dm, dm.bad
#> The following objects are masked from dupRadar_examples (pos = 4):
#>
#>     dm, dm.bad

# duprate plot
duprateExpDensPlot(DupMat=dm)